Each event has a set of tabs that show how it is selling, from the first sign-up to the last ticket. They sit after the page tabs you already know (Overview, Design & Setup, Sign-ups and Stats). Open an event from Events in the menu, then click a tab. This guide explains what each tab shows and where each figure comes from.
How the event tabs work
- One headline and one big chart first. Each tab opens with a sentence that answers the main question, then a row of figures and a chart. Tables and notes sit in folds further down: click any fold to open it.
- Every figure says where it came from. Under each card a small line names the source and its age, for example Skiddle, See Tickets · 4 min ago.
- Pick a period. Sales and Ads have Whole campaign, Last 7 days and Last 30 days chips.
- Tabs need their source. A tab shows once its source is connected: Sales and Abandoned carts need your ticket agent, Ads needs Meta and Live needs Google Analytics. Results always shows and tells you what is missing.
Results
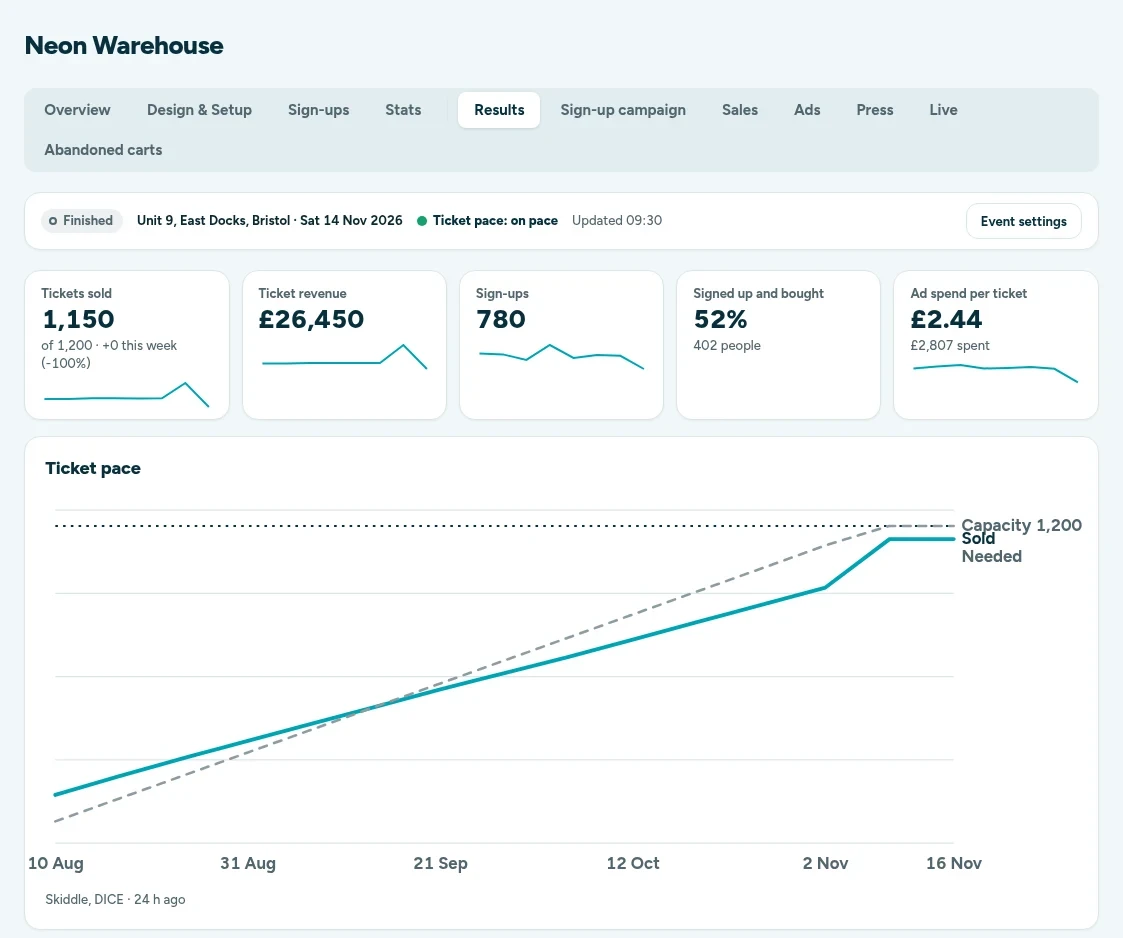
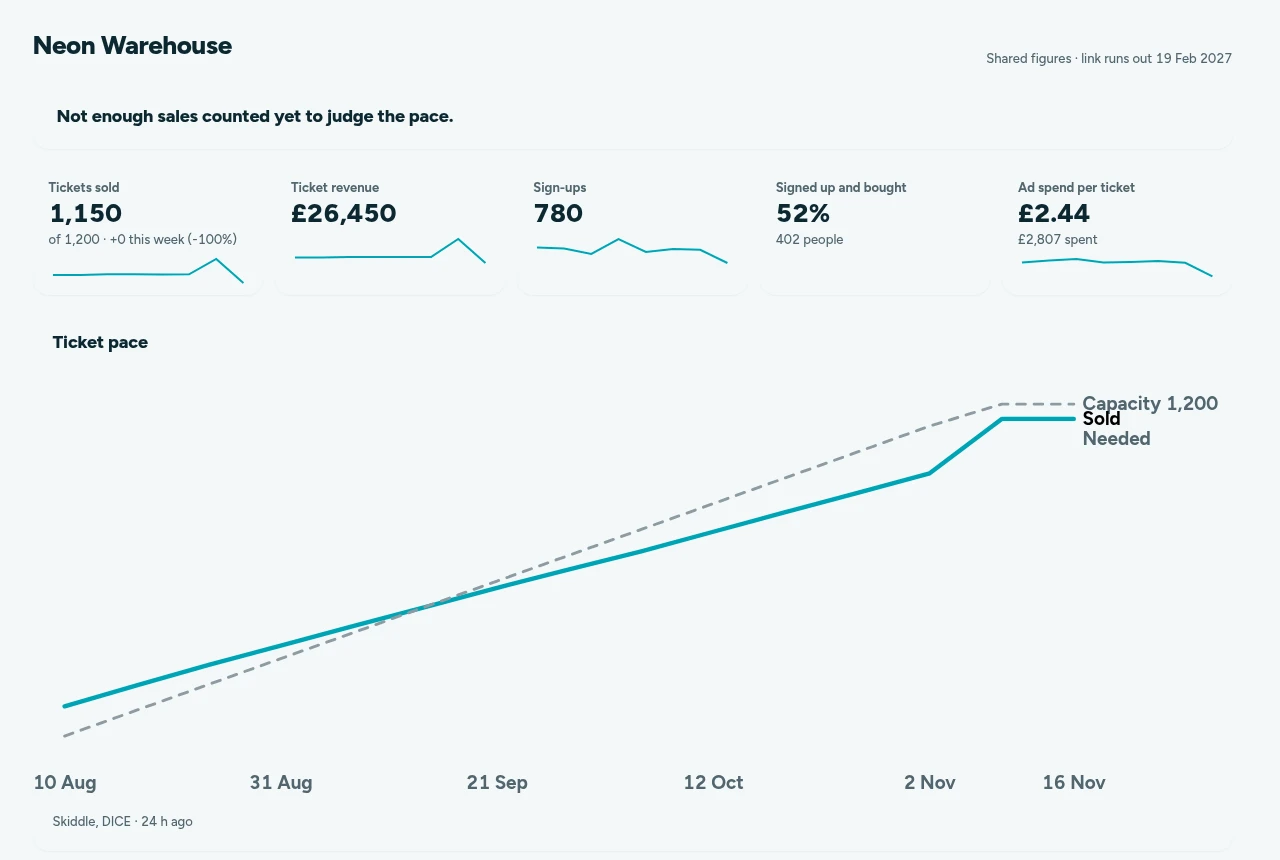
Results answers one question: will this event sell out? The headline compares how fast tickets are selling with how fast they need to sell to reach capacity by the show, for example Selling 1.4× faster than needed. When it can, it adds the date you would sell out at this rate.
The figures row shows Tickets sold (of capacity, with this week's sales), Ticket revenue, Sign-ups, Signed up and bought (the share of sign-ups who went on to buy) and Ad spend per ticket.
The Ticket pace chart draws tickets sold so far, a dashed Needed line from the first sale to capacity on the show date, and an At this rate line that carries on today's selling speed.
Below the chart:
- From visit to ticket: page visits, sign-ups and buyers, with the share that moved on at each step.
- What brought buyers: the channel each buyer first came from, such as email, Meta, SMS or WhatsApp. Buyers are matched overnight.
- Where buyers live: the top postcode areas, shown as towns, for example Bristol (BS).
- Needs you: anything that needs a decision from you.
How pace is judged
Pace compares recent weekly sales with the weekly sales still needed to reach capacity by the show date. It reads ahead, on pace, slipping or behind. Until there are enough sales to judge, it says so rather than guessing. Open the How pace is judged fold on the tab for the exact rule, and Every figure and where it comes from for each figure with its source.
Sign-up campaign
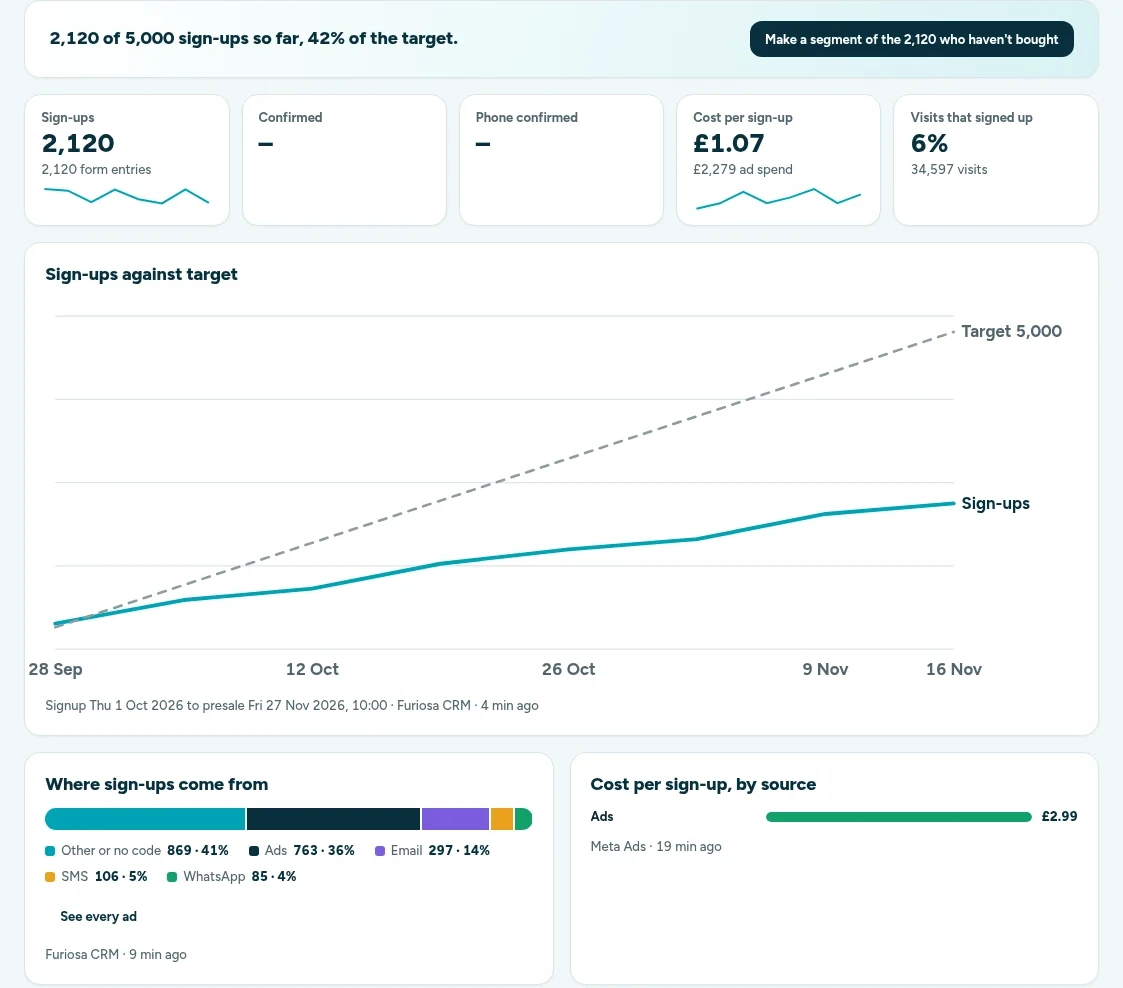
Sign-up campaign tracks the run-up before tickets go on sale. The headline shows sign-ups against your target, for example 2,120 of 5,000 sign-ups so far, 42% of the target. Set the target in Event settings.
- Figures: sign-ups, confirmed, phone confirmed, cost per sign-up and the share of visits that signed up.
- Sign-ups against target: a running total against a straight line to your target by the presale date.
- Where sign-ups come from: ads, email, SMS, WhatsApp and other sources, as a share of the total.
- Cost per sign-up, by source and What each push brought: what each email, text or ad change added.
- Best days and hours: sign-ups by weekday and hour, UK time.
- Who are they?: age, gender, the typical household income where they live and social grade. These are rough estimates for the town, not for the person.
Sales
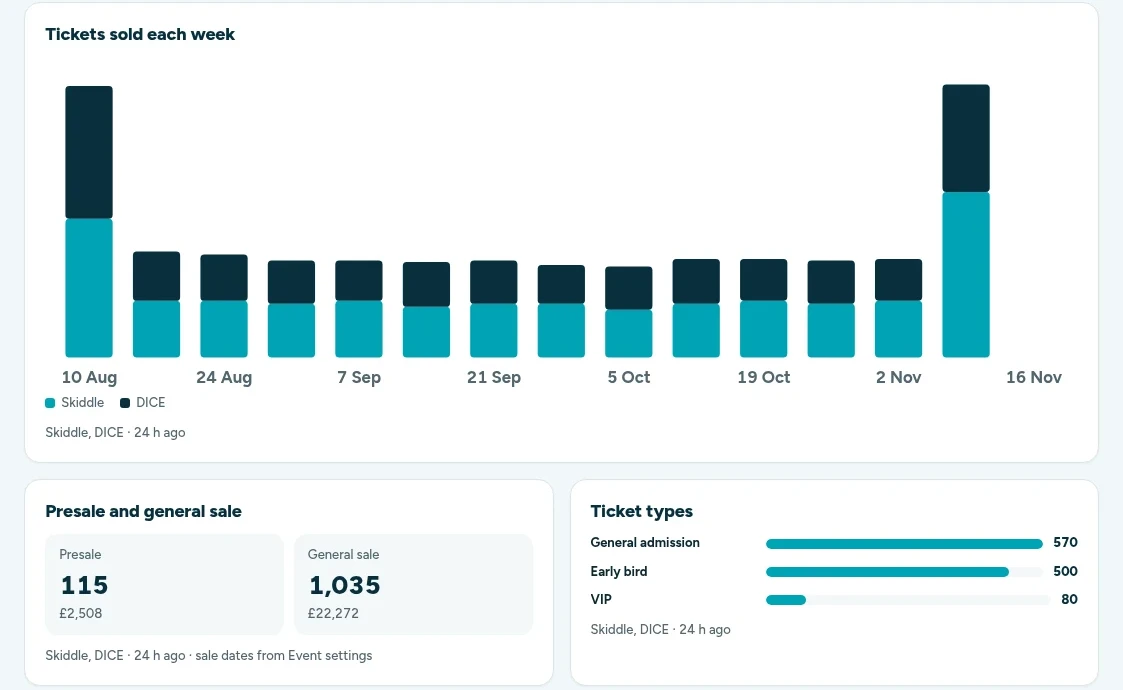
Sales shows tickets as your ticket agents report them. The figures row has tickets sold, revenue, this week, average order and, when it can be worked out, the date it sells out.
- Tickets sold each week: stacked bars, one colour per ticket agent, such as Skiddle, See Tickets or DICE. Sales from your own Furiosa ticket shop show here too.
- Presale and general sale: tickets and revenue in each, using the sale dates in Event settings.
- Ticket types: what sold, for example Early bird, General admission and VIP.
- What each push sold: tickets in the days after each email, text or ad change.
- Where buyers live, plus folds for sales by tracking link, every week and day, and every area.
Ads
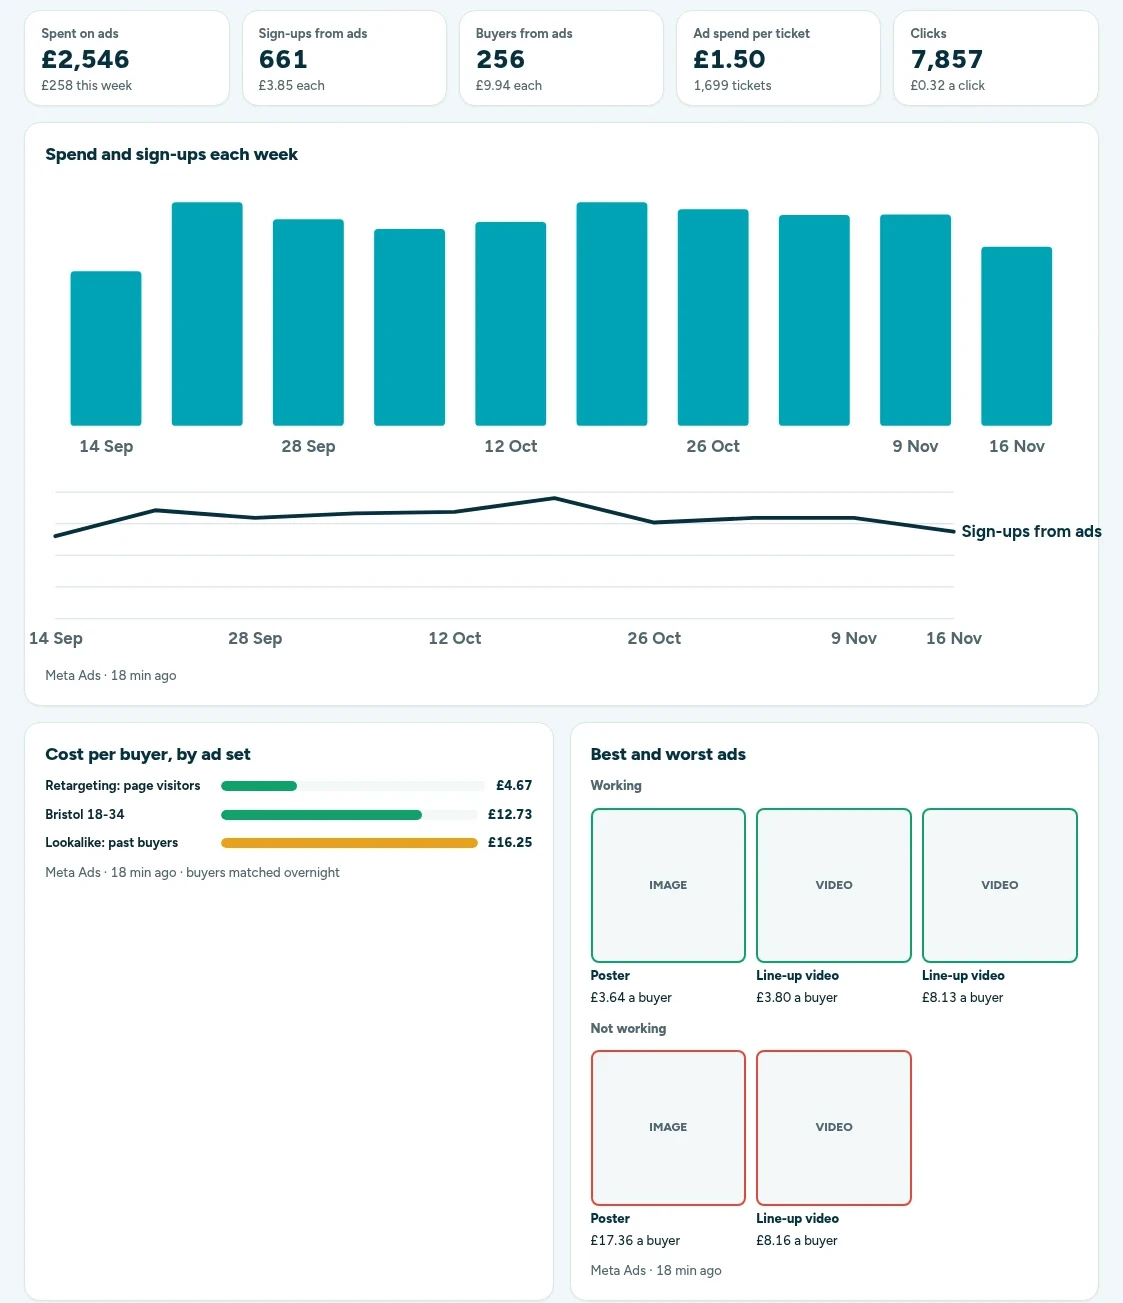
Ads shows what your Meta ads for this event cost and what they brought in. The headline gives the ad spend per ticket. The figures row has spend, sign-ups from ads, buyers from ads, ad spend per ticket and clicks.
- Spend and sign-ups each week.
- Cost per buyer, by ad set: the cheapest ad sets in green, the dearest in amber.
- Best and worst ads: the ads that are working and the ones that are not, with their cost per buyer.
- Which kind of ad works: video against image.
- Where ad sign-ups live, by postcode area.
- What to do with each ad: a short suggestion per ad, such as moving money out of an ad set.
How ads are matched to an event
An ad counts for an event when its campaign name contains the event's PO code, or one of the other codes listed in Event settings. Buyers are matched to ad sets overnight. Open How ads are matched to this event on the tab to see the codes it uses.
Press
Press shows the coverage your event is getting: press articles with the visits and sign-ups each one sent, Where you rank on Google for the searches people use, What people searched and every other site that sent people to your page. Click Download press report (PDF) for a copy to send on.
Abandoned carts
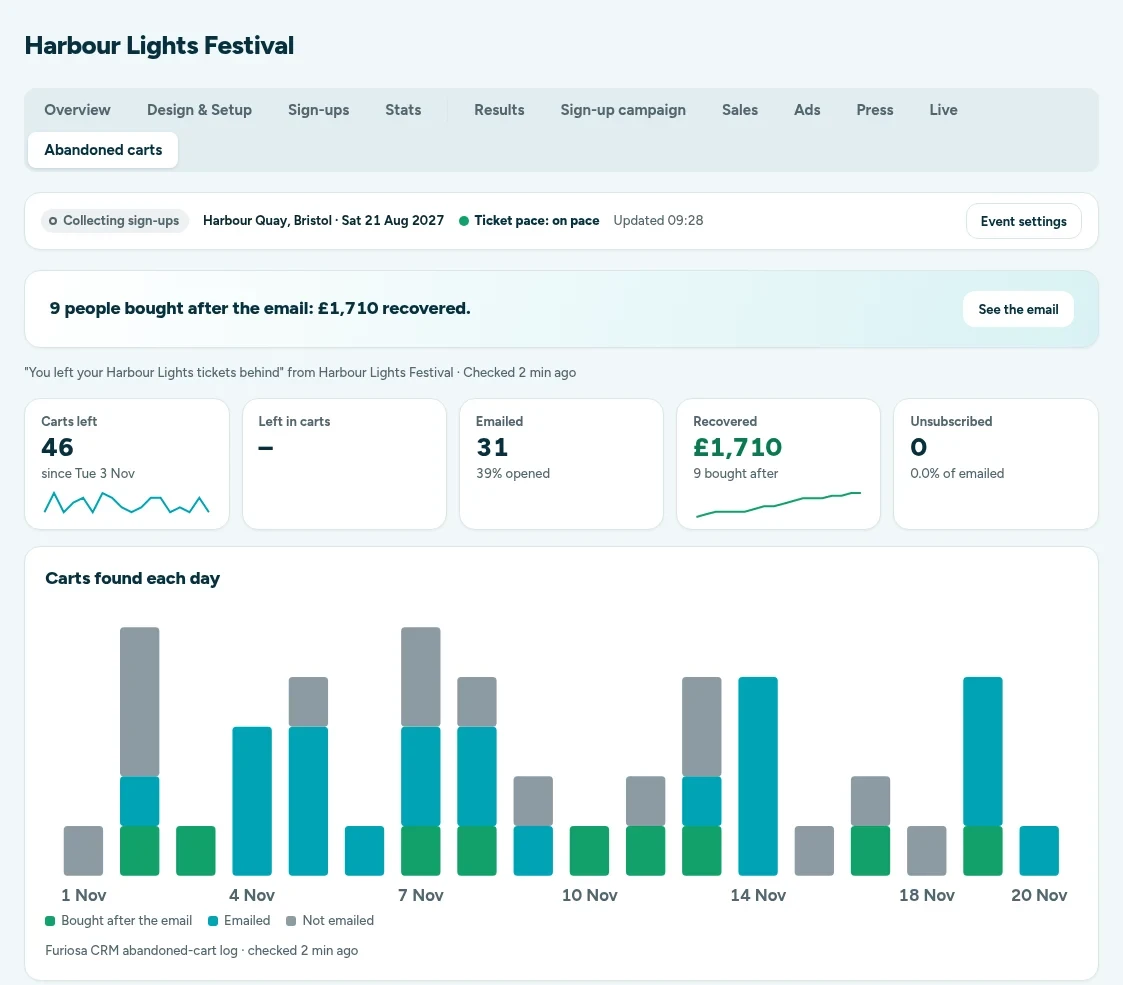
If you sell through a ticket shop that reports abandoned carts, such as Easol, this tab follows them up. The headline gives the result, for example 9 people bought after the email: £1,710 recovered.
- Figures: carts left, emailed, recovered and unsubscribed.
- Carts found each day: split into bought after the email, emailed and not emailed.
- Follow-up email: emailed, opened, clicked and bought after. The email goes 30 minutes after a cart is found. Click See the email to read it.
- By ticket type and Not emailed, with the reason, such as already bought or unsubscribed.
Wrap report and festival report
When an event has one, a report tab appears after the others.
- Wrap report fills in two days after the show. It sums up the campaign: tickets sold against steady selling, sign-ups to buyers, ticket types, the best pushes and a comparison with an earlier event.
- Festival report is for festivals that sell through Easol. It compares every year side by side: sales pace, who came back, who has paid and what is still to come, party size, and who to talk to next.
Making a segment from an event
On Sales and Sign-up campaign, the headline has a Make a segment button, for example Make a segment of the 838 still to buy. The segment you can make from an event can be:
- Everyone who signed up.
- Opted in: people who agreed to marketing.
- Signed up and bought.
- Didn't buy: sign-ups who have not bought yet.
- Opened nothing: people who opened none of your emails.
The segment opens in Audiences → Segments, ready to send a campaign to or push to Meta and TikTok as an ad audience. See the Audiences guide.
Sharing figures with artists and venues
You can send an artist, agent or venue a link to an event's figures. They don't need a login.
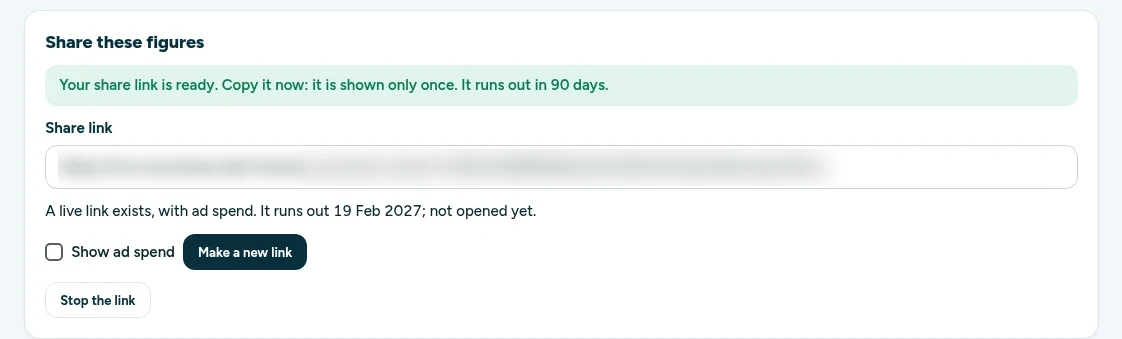
- Open the event's Results tab and scroll to Share these figures.
- Tick Show ad spend if you want them to see it. It is left out unless you tick it.
- Click Make a link, then copy it straight away. It is shown only once.
The link opens a read-only page with the event's results. It never shows anyone's name, email or phone number.
- Each event has one live link at a time. Make a new link stops the old one.
- A link runs out after 90 days. The card shows when, and when it was last opened.
- Click Stop the link to switch it off at once. Anyone who has it then sees nothing.
Alert emails
- Pace alert: one email on the morning an event slips off pace. You won't get another until it is back on pace and slips again.
- Morning briefing: each morning there is a live show, a summary of how your shows did yesterday. A team member gets only the shows they lead.
- Press alert: when press coverage starts lifting sign-ups for an event.
Alert emails never include fans' names, emails or phone numbers.